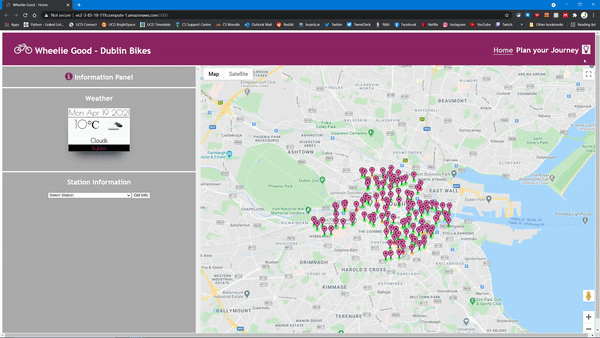
Home
  • About Me
  • Search
Navigation bar avatar
✕

    Jason Ballantyne's Portfolio


    Cyber Security Data Engineer | MSc Computer Science

    Best Bus

    Dublin Bus real time journey planner and arrival time prediction web app

    Posted on May 1, 2022

    Post thumbnail
    Post thumbnail
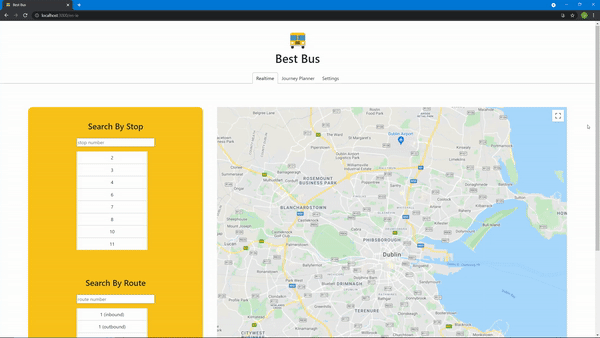
    Real Time Journey Planner and Arrival Time Prediction Web App for Dublin Bus. Built using React and Django and uses ML techniques to predict journey times. [Read More]
    Tags: data-science pandas numpy seaborn random-forest linear-regression knn logistic-regression decision-tree

    Wheelie Good

    Dublin Bikes self-service web application

    Posted on April 26, 2022

    Post thumbnail
    Post thumbnail
    A clean and functional web application designed for a user to navigate the Dublin Bikes self-service rental system. The user can find the closest available bike, plan their bike route, obtain weather information, visualise availability graphs as well as a host of additional features. [Read More]
    Tags: data-science pandas numpy api flask random-forest sklearn linear-regression amazon-web-services

    Covid-19 Predictive Models

    Training and evaluating prediction models for the Covid-19 pandemic

    Posted on April 10, 2022

    Post thumbnail
    Post thumbnail
    This project focuses on training and evaluating prediction models for the Covid-19 pandemic to find a model which best predicted the binary outcome of death. [Read More]
    Tags: data-science pandas numpy seaborn scipy sklearn random-forest linear-regression logistic-regression

    Big Data Stack

    Managing concepts using Bash, SQL/NoSQL, Hadoop, Spark and GraphX

    Posted on March 25, 2022

    Post thumbnail
    Post thumbnail
    Walking through a complex set of concepts that form the Big Data stack. Setting up Big Data environments, using efficient data management operations and running algorithms to the scale and speed required by Big Data datasets. [Read More]
    Tags: data-engineering bash sql spark hadoop nosql graphx big-data

    Eurostat Crime Analysis

    Manipulating, analysing and creating a creative component to the EurostatCrime2019 dataset using R

    Posted on March 3, 2022

    Post thumbnail
    Post thumbnail
    Using the EurostatCrime2019.csv for this analysis. This dataset records offences (values per hundred thousand inhabitants) by offence category in 41 European Countries in 2019. [Read More]
    Tags: data-science r ggplot2 tidyverse cowplot data-visualization
    • Older Posts →
    • Email me
    • GitHub
    • LinkedIn

    Jason Ballantyne  •  2024

    Powered by Beautiful Jekyll